
The L-shape relationship between hemoglobin, albumin, lymphocyte, platelet score and the risk of diabetic retinopathy in the US population
Background: The primary aim of this study was to investigate the correlation between diabetic retinopathy (DR) and the HALP score (hemoglobin, albumin, lymphocyte, and platelet) in individuals with diabetes within the United States population. Methods: This cross-sectional investigation was based on the National Health and Nutrition Examination Survey (NHANES) database from 2003-2018.
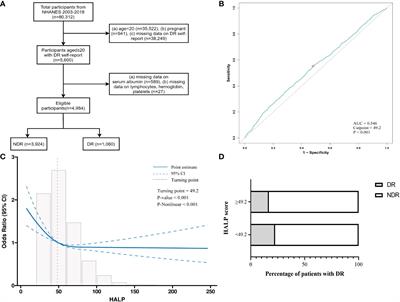
The following module calculated the HALP score: HALP score = [lymphocytes (/L) × hemoglobin (g/L) × albumin (g/L)]/platelets (/L). By performing the receiver operating characteristic (ROC) analysis, the optimal cutoff value of HALP was ascertained. Restricted cubic splines (RCS), multivariable logistic regression analysis, sensitivity analysis, and subgroup analysis were conducted to evaluate the effect of the HALP score on DR patients. Finally, the decision curve analysis (DCA) and clinical impact curve (CIC) were conducted to estimate the predictive power and clinical utility of the HALP score with clinical indicators. Results: According to the cutoff value (42.9) determined by the ROC curve, the participants were stratified into a lower HALP group (HALPlow) and a higher HALP group (HALPhigh). An L-shaped relationship between HALP score and DR risk was presented in the RCS model (P for nonlinearity <0.001).
The DR risk sharply decreased with the increase of HALP, and the decline reached a plateau when HALP was more than 42.9. After fully adjustment, the multivariate logistic regression analysis found that HALPlow was an independent risk factor for DR (OR = 1.363, 95% CI: 1.111-1.671, P < 0.001). Besides, sensitivity analysis showed consistent results. Furthermore, the combination of HALP score and clinical indicators demonstrated predictive power and clinical utility, as shown by the ROC curve, DCA, and CIC. Conclusion: The HALP score has an L-shaped correlation with the risk of DR, and thus, the HALP score may contribute to the timely intervention of diabetes patients.
Read the full article at the original website
References: